Global Markets. Elliott Wave, structure, scenarios.
S&P 500, Nasdaq, and DAX daily, plus 40 equities on a two-week rotation. Futures, gold, silver, platinum, palladium, oil, and natural gas. Five tiers, from pure analysis to coverage on member request.
Prices shown are for the UK and include 20% VAT. Outside the UK, Patreon adds the VAT or sales tax of your country to the net price at checkout. EUR values are indicative · Billed in GBP via Patreon · Free Discord account required · Cancel any time
How it works
How to join.
It takes minutes from clicking the Patreon button to your first analysis.
1
Start your membership
Join via Patreon. Billing runs monthly in GBP. Pay by card or PayPal. Cancel any time.
2
Connect Discord
Connect your Discord account in your Patreon settings; two clicks. Depending on your tier, the relevant channels and TradingView access unlock automatically.
3
Be part of it
Daily analysis, Market Express, the Elliott Wave library. From Advanced upwards, also: ask questions, discuss setups, talk with other members.
Coverage
What is covered, and how often.
Daily market presence, structured rotation. Three indices daily, equities in blocks of 4 per day, futures and commodities as market conditions warrant.
Searches both memberships: MCO Markets and MCO Digital Assets.
Daily · indices
Daily
SPX
S&P 500
Daily Elliott Wave analysis
Daily
NDX
Nasdaq
Daily Elliott Wave analysis
Daily
DAX
DAX
Daily Elliott Wave analysis
40 equities · two-week rotation
Written analysis of every name each week. Video analysis every two weeks, four names per trading day as shown below.
Monday
AAL
American Airlines
AAPL
Apple
ADBE
Adobe
AMD
AMD
Tuesday
BA
Boeing
BABA
Alibaba
COST
Costco
CRML
Critical Metals
Wednesday
HOOD
Robinhood
IONQ
IonQ
JD
JD.com
META
Meta
Thursday
NOW
ServiceNow
NVDA
Nvidia
PLTR
Palantir
PYPL
PayPal
Friday
SBUX
Starbucks
TGT
Target
TEAM
Atlassian
TSLA
Tesla
Monday
AMZN
Amazon
ARM
Arm Holdings
ASML
ASML
AVGO
Broadcom
Tuesday
CRWD
CrowdStrike
DDOG
Datadog
DIS
Disney
GOOGL
Alphabet
Wednesday
MU
Micron
MSFT
Microsoft
NFLX
Netflix
NKE
Nike
Thursday
QBTS
D-Wave Quantum
QCOM
Qualcomm
RIO
Rio Tinto
XYZ
Block
Friday
UEC
Uranium Energy
UUUU
Energy Fuels
WBD
Warner Bros Discovery
XOM
Exxon Mobil
100+
From Advanced upwards, the universe opens
Over 100 chart updates per week · all asset classes
The 40 equities above are the fixed base. From Advanced upwards,
the dynamic market rotation is added, plus every chart that
Professional and Elite members individually request. You see not only your
own coverage but everything generated across the community.
Professional and Elite can request anything: additional US equities, international markets (DAX, FTSE, Nikkei, etc.), FX pairs,
exotic commodities, foreign individual equities. No restriction
to a single asset class. Together this produces 100+ chart
updates per week, across the entire market universe.
Regularly · futures & commodities
ES
S&P E-Mini Futures
NQ
Nasdaq Futures
Gold
XAU/USD
Silver
XAG/USD
Platinum
XPT/USD
Palladium
XPD/USD
Oil
WTI Crude
NatGas
Natural Gas
What you get
What is included.
Daily analysis, compact video updates, live charts, and a space where markets are discussed seriously.
Core
Daily Elliott Wave analysis
Detailed written market updates on S&P 500, Nasdaq, and DAX every trading day, plus 4 equities per day from the 40-equity rotation. Short-term waves (1H / 4H), higher-timeframe structure (daily / weekly), confirmation and invalidation levels.
Daily Market Express video
Compact video updates on the covered equities, general market structure, and important developments in indices and futures. From Advanced upwards, a weekly technical video in addition.
TradingView live charts
Pre-drawn waves, levels, and targets right on your TradingView chart. For every covered market. Included from Basic & Charts.
MCO Terminal · Early Access
More than 80 tools, among them the Cycle Engine, seasonality and Hurst cycles, the Earnings Lab, valuation bands, sector strength and the macro calendar. Access included in every tier, with early access to new releases.
Community & Discussion
A private community to discuss setups, ask questions and learn from other members. Included from Advanced upwards; from Professional upwards, a weekly webinar in addition.
The setups Elliott Wave traders look for. In one report.
Every analysis that flags one of the chart setups Elliott Wave traders look for, collected and sorted in one research report: equities, indices, commodities and crypto, each as its own report, in English and German.
Every setup in the same structure. Leading scenario, risk scenario, support and resistance, bottom line and the level at which the count is invalidated.
The chart as it was published. Each entry carries the original chart with its date, so you see the count as it stood at the time.
An overview for equities. The equities report opens with a table of every name, with quality score, valuation and trend.
216Pages
192Instruments
4Reports
Edition of 27 September 2026, English version. For members of Advanced, Professional and Elite. General research, not a personal recommendation. Charts show the market at the time of each analysis.
More than 80 tools for cycles, seasonality, valuation, earnings and macro. Included in every tier, with early access to new releases.
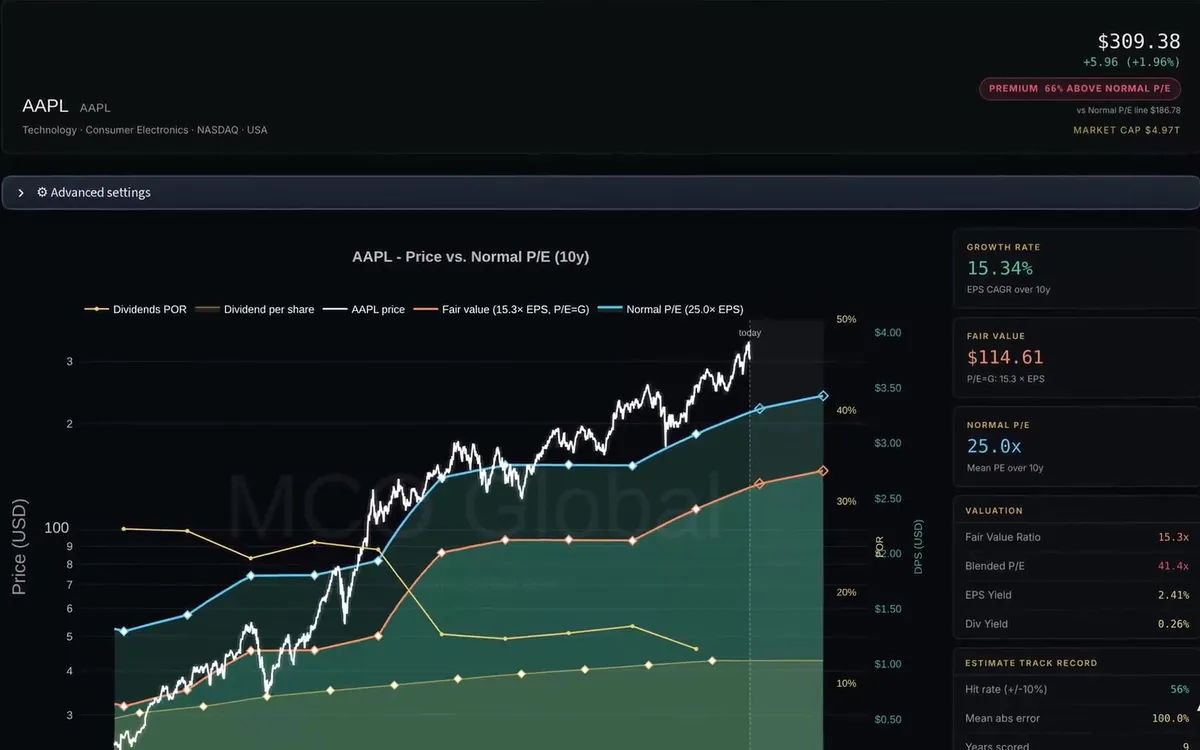
MCO Terminal · Valuation Bands
Valuation Bands. Today's price against a decade of the company's own earnings power, with fair value and normal P/E bands. Shown here: Apple.
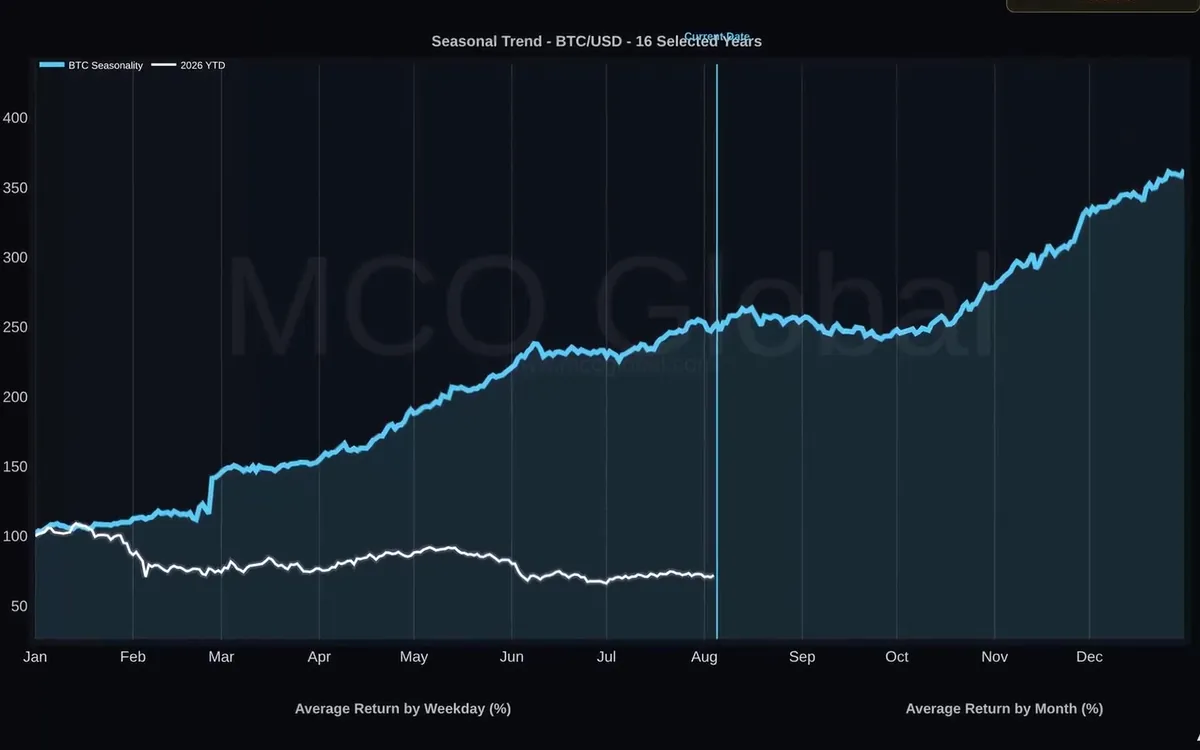
MCO Terminal · Seasonality
Seasonality. How an asset typically moves through the year, built from its full price history, with the current year drawn over it.
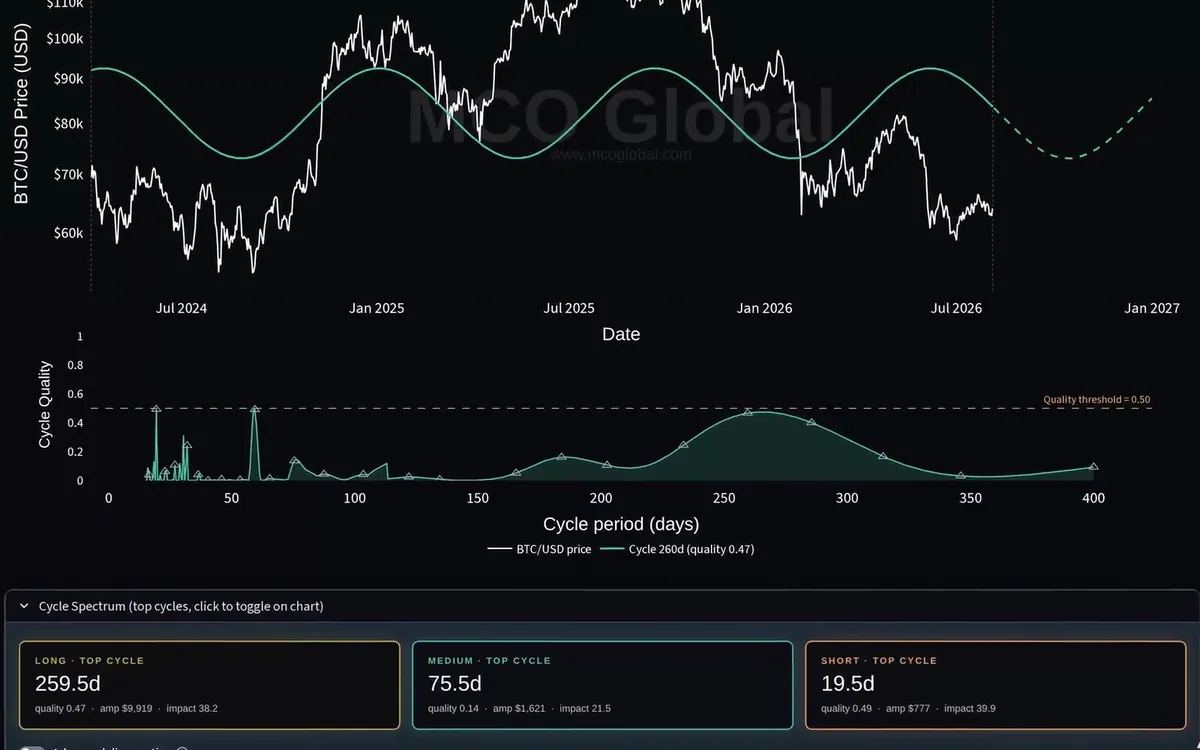
MCO Terminal · Cycle Engine
Cycle Engine. Finds the dominant cycles in a market, scores their quality and projects them forward on the chart.
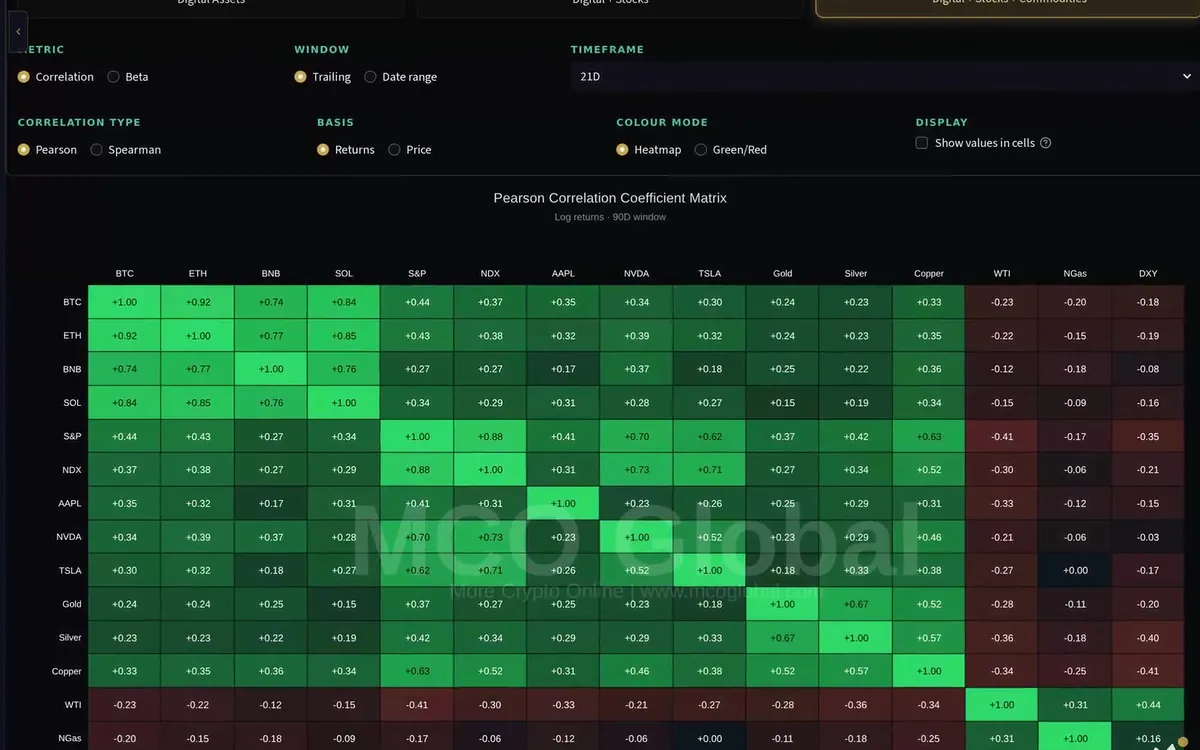
MCO Terminal · Correlation Matrix
Correlation Matrix. How crypto, indices, stocks and commodities move together. What looks like five different positions is often just one.
Screens from the MCO Terminal (early access). Tools and layouts change as the Terminal develops.
MCO Framework
How the analysis is built.
The MCO Framework brings cycles, macro, and fundamental data together into one view. The components adapt to the asset class; the structure stays the same.
01 · Cycles
Structure and time
Elliott Wave counts on weekly and daily timeframes for chart structure, alongside time cycles like Cycle Engine, Hurst, and seasonality for timing.
02 · Macro
Market environment
Liquidity, rates, risk-on / risk-off. The macro layer places wave structure within the larger cycle.
03 · Fundamentals
Data
EPS, P/E, revenue growth, earnings reports, and sector trends. They confirm a wave count or flag a risk before the chart does.
The three layers are weighted by market conditions. In quiet phases, higher-timeframe counts are enough. In volatile phases, intraday updates are added. The methodology stays consistent across every market, from the S&P 500 through individual equities to gold and oil.
For digital assets, fundamentals are replaced by on-chain analysis (wallets, flows, ETF data, MVRV, SOPR). The methodology stays the same; the data layer adapts to the asset class.
The MCO chart language
How to read an MCO chart.
Every MCO chart uses the same language. Seven elements, one stylised example.
Stylised example with illustrative values. Not a live chart and not a recommendation.
Seven elements, one language
Every MCO chart is built from the same seven elements. Pick one in the list or tap a glowing dot on the chart to see what it means and where it sits.
Wave count
Numbers mark motive waves, letters mark corrections. Labels like (1) (2) (3) belong to the larger structure, i ii iii count the waves inside it. A question mark, as in (4)?, means plausible but not yet confirmed by price.
Support zone
The orange box is a Fibonacci support zone, calculated from the wave structure: where a correction is most likely to end. It is a condition, not a promise. The question is not whether price touches it, but whether it holds.
Resistance
Red Fibonacci boxes, drawn with their percentages, mark resistance: the retracement band of the prior decline, where counter-trend bounces tend to stall while a correction is still running.
Target zone
The blue box is the extension target, where the next motive wave has a mathematical basis to complete. It says nothing about timing, and it is only as valid as the count it is projected from.
Invalidation
The single red line is the most important line on the chart. A sustained break means the reading is objectively wrong, and the scenario is retired, not defended. Every scenario MCO publishes has a level like this.
Breakout level
The green line is the confirmation side. A sustained move above it means the correction is complete and the next motive wave is likely underway. Between the zone and this line, nobody knows yet, and the chart says so.
Primary and alternative
The solid path is the primary scenario, the dotted path is the alternative that takes over if the primary is invalidated. Both are always shown. Arrows describe direction and structure, never timing.
If this, then that. If price holds the orange zone and turns, the primary scenario is playing out.
If it breaks the red line in a sustained way, the alternative takes over. If it clears the green line, the primary is confirmed.
Every condition can be checked on the chart.
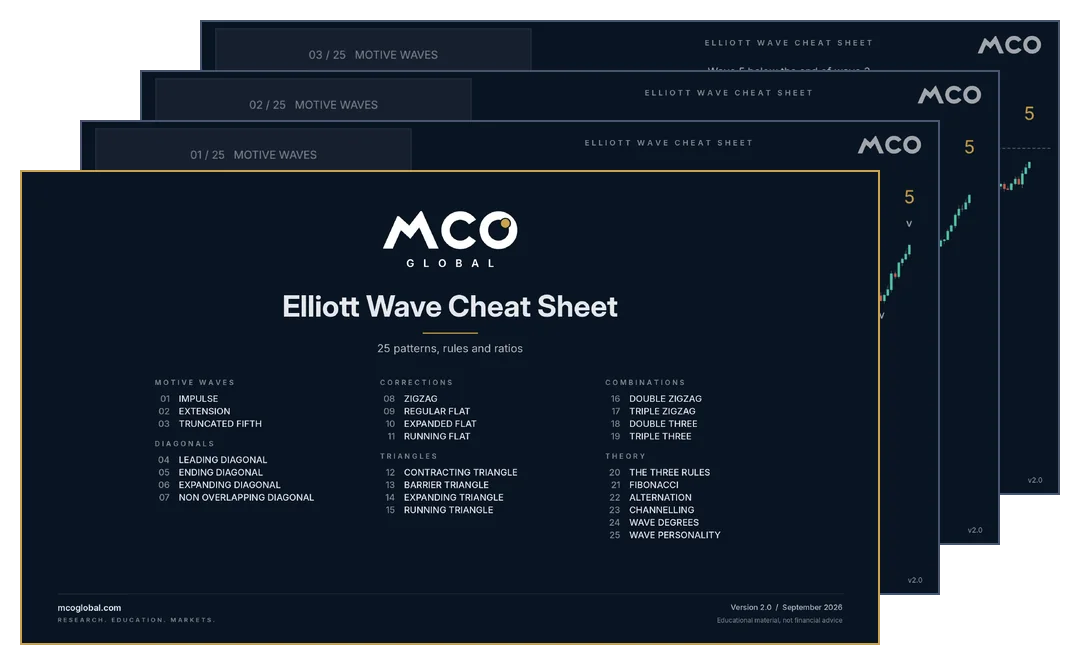
Every pattern on one sheet. The MCO Elliott Wave Cheat Sheet: 25 patterns, rules and ratios, free when you subscribe to MCO Intelligence.
Founded in 2021 with a global outlook from day one. What started internationally in English grew, on repeated request, into German and Spanish-language offerings. Today MCO is a network of active communities across three language regions. Organically grown, still growing.
Daily analysis, live charts and in-house research tools, built on one consistent method and made for individual market participants.
2021Founded
3Language regions active
Dailymarket analysis
FAQ
Frequently asked questions.
Which tier is right for me?
Quick guide: Basic is the pure analysis access without
live charts and community, ideal if you just want to read the daily updates.
Basic & Charts adds the TradingView live charts so you
can follow market moves directly. Advanced adds the private
community, the weekly technical video and the Chart Setup Report; this is the tier for active market
participants. Professional comes with a weekly webinar and
individual equity requests. Elite doubles the requests to
4 per week and is aimed at members who want the most influence over which markets are analysed.
Is VAT included in the price?
Yes for the United Kingdom: the large prices include 20% UK VAT,
because that is what a UK member pays. Outside the UK the net price applies
(shown below each price, for example £30 for Basic), and Patreon adds the
VAT or sales tax of your country of residence at checkout. You see the final
total before you complete the purchase. Prices are set in GBP.
What additional coverage do I get from Advanced upwards?
The 40 equities from the two-week rotation are the fixed base for every tier.
From Advanced upwards, two additional coverage layers are added:
the dynamic market rotation, in which additional names are
analysed flexibly depending on market conditions, and access to every
chart that Professional and Elite members individually request.
Together this produces 100+ chart updates per week, well beyond the standard
rotation.
How does signing up via Patreon work?
You choose the tier you want on Patreon and book it monthly. Immediately
after, you connect your Discord account in two clicks and the relevant
channels and TradingView access unlock automatically. No separate registration,
no second account.
Can I upgrade or downgrade later?
Yes, at any time. Patreon allows you to switch between tiers directly in
your account settings. The change takes effect at the next billing cycle;
the unlocked channels and access adjust automatically.
Can I cancel any time?
Yes. Patreon subscriptions are cancellable monthly. You lose access at the end of the current billing month; no hidden notice periods.
Why is billing in GBP?
MCO Global Ltd is based in London, so billing runs through Patreon in British
pounds. EUR values on this page are reference figures and fluctuate with the
exchange rate.
Which equities are analysed?
40 carefully selected equities run in blocks of 4 per trading day across
a two-week rotation, Monday to Friday in both weeks. Written analysis is
weekly, video analysis every two weeks. The full list, week by week, is
shown above under "Coverage."
Can I request individual equities?
Yes, from the Professional tier. That includes 2 individual
requests per week; in Elite you get 4 per week. You
can request anything: additional US equities, international markets
(DAX, FTSE, Nikkei, etc.), FX pairs, exotic commodities, foreign single names.
No restriction to a single asset class. From Advanced
upwards, a dynamic market rotation is also included, in which additional
markets are analysed flexibly depending on market conditions.
Requested analyses are shared with the community like every other analysis
and are not tailored to personal circumstances.
Are futures and commodities always covered?
Yes, at no extra charge in every tier. ES and Nasdaq futures, gold, silver,
platinum, palladium, oil, and natural gas are analysed regularly. Frequency depends on market
conditions and relevance. Where things are moving, more updates; where things
are quiet, you keep the overview without the noise.
Do I need prior Elliott Wave knowledge?
No. Every tier includes access to the educational library, from the
fundamentals through to advanced application. You can start immediately and
learn alongside. From Advanced upwards, you can also ask questions directly
in the community.
Are updates published on weekends as well?
Generally not. The analyses follow the trading hours of the covered markets
and run Monday to Friday. On weekends there are usually no updates, except
in the case of market-moving events.
How much time do I need?
It depends on how intensively you want to engage with the markets. Many
members check the written updates and Market Express video briefly after
work. Others spend significantly more time on charts, webinars, and the
discussion in the community. The platform is deliberately set up so that
both working professionals and very active market participants can keep
their own rhythm.
What's the difference compared to what's on YouTube?
YouTube shows a curated selection: one video per day or week.
In the membership you get daily updates on every covered market, detailed
wave counts with concrete levels, the daily Market Express video, TradingView
live charts (from Basic & Charts upwards), and the community discussion
from Advanced upwards.
What is Discord and why do you use it?
Discord is an established communication platform with its own apps for
desktop, web, and mobile. A free account is all you need to access the
MCO area. We deliberately use Discord rather than building our own platform:
a custom system would be more maintenance-heavy and would push prices higher.
Discord has proven itself over years, scales reliably, and enables real-time
discussion. This way our resources go into analysis quality and education,
not into infrastructure.
Do I have to be active in the community?
No, and in Basic as well as Basic & Charts
community access is not included anyway. From Advanced upwards, many members
mostly read silently and follow the discussions while others participate
actively. Both are completely fine; there is no pressure to participate.
Is there a trial month or a refund?
Patreon works on monthly billing. There is no trial month because signing
up immediately unlocks the full content of the selected tier. You can cancel at
any time, and the membership runs out at the end of the paid month. Your
statutory cancellation rights are not affected; section 8 of our
Terms explains cancellation and refunds.
Is there a Markets and Digital Assets bundle?
Currently Markets and Digital Assets are two separate memberships via
Patreon. If you want to cover both asset classes, you can book both
memberships. We are considering a future bundle if demand develops.
Is everything usable on mobile?
Yes. Discord is natively mobile-optimised with its own app, TradingView
runs on mobile just as on desktop, and the written updates plus the Market
Express video are readable and playable on every device. The MCO Terminal
is currently desktop-focused in its early-access state; mobile optimisation
is on the roadmap.
In which language are the analyses delivered?
The analyses in the member channel and the community discussions are
delivered in English.
Start with MCO Markets.
Daily Elliott Wave analysis across indices,
equities, futures, and commodities. Five tiers, from £36 a month incl. UK VAT.
Cookie notice
This website uses no tracking and no marketing cookies. It sets one technically necessary session cookie and stores in your browser that you have seen this notice. Links to third-party platforms such as Patreon or YouTube open their own websites, which set their own cookies. Details in our Cookie Policy.