
Elliott Wave theory suggests that public sentiment and mass psychology move in identifiable patterns: five waves in a primary trend and three waves in a counter-trend. After a five-wave movement in public sentiment concludes, a natural psychological shift in the opposite direction occurs, independent of external news events.

Investor and financial analyst Robert Prechter has discussed this phenomenon extensively, emphasizing that stock market movements are driven by human psychology and waves of optimism and pessimism, rather than by external factors alone.
Elliott Wave theory is based on the idea that progress and regression do not follow a straight line or occur randomly but instead follow a pattern of three steps forward and two steps back within a primary trend. This cyclical pattern, inherent in collective human behavior, is known as the “herding principle” and is fundamental to the Elliott Wave theory.
The concept of the Golden Ratio, or Phi, enhances this theory. This ratio has been recognized throughout history by figures such as Plato, Pythagoras, Bernoulli, DaVinci, and Newton, as well as by the architects of the Parthenon and Notre Dame Cathedral. Their use of Phi underscores its timeless relevance.
For a comprehensive understanding of this theory, consider reading “Elliott Wave Principle” by Frost & Prechter.
Basics of Elliott Wave Theory
In Elliott Wave theory, movements in the direction of the trend are called “impulsive” and consist of five waves, while movements against the trend are termed “corrective” and consist of three waves. Within an impulsive five-wave move, waves 1, 3, and 5 follow the primary trend, while waves 2 and 4 are counter-trend.
Since markets are fractal, these impulsive and corrective patterns appear at all levels and time frames, with smaller sub-waves mimicking the patterns of larger waves.
Fibonacci Ratios and Market Movements
Tracking impulsive or corrective counts relies heavily on Fibonacci ratios of extensions and retracements based on the Golden Ratio. Typically, a five-wave move aligns with Fibonacci levels, reacting at specific points. For example, Wave 1 might extend to the 38.2% or 61.8% level, then Wave 2 often retraces to the 50% or 61.8% level of Wave 1. Wave 3, which usually subdivides, helps differentiate between a five-wave impulsive move and a three-wave corrective move.
Corrective Waves
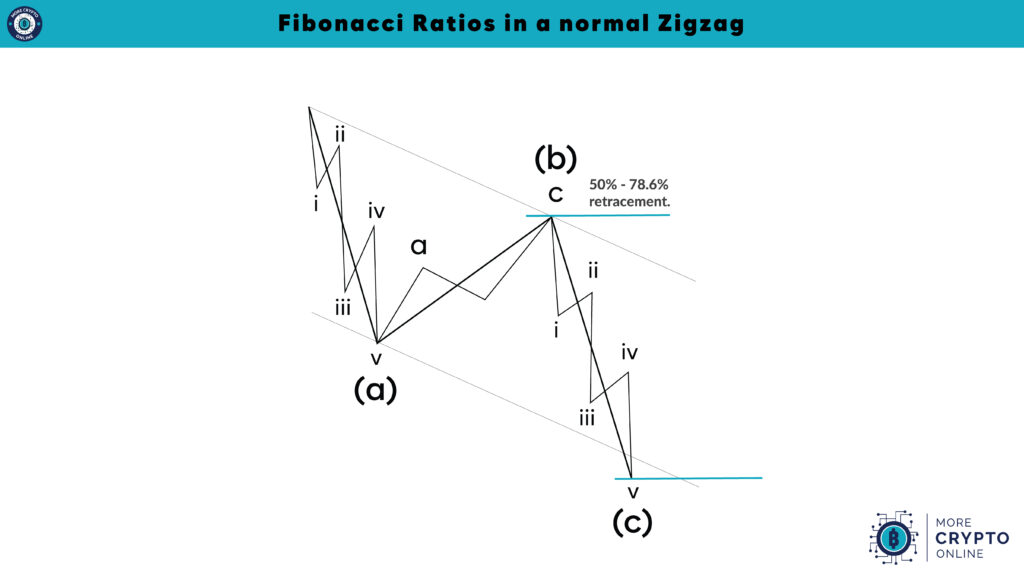
A standard three-wave corrective move often has a first wave (a-wave) that equals the length of the third wave (c-wave) in the correction. In this pattern, the market usually reaches the 100% extension of the a-wave during the c-wave. After a correction is complete, the market will reverse after the end of the (C)-wave and move into the trend direction (up in this case). Corrections can take many forms, such as triangles, flat structures or zigzags. There are even more complex combinations. When dealing with corrections, the focus should be on preserving capital.
Impulsive Waves
In am impulse, which is the most reliable Elliott Wave pattern, wave 3 is usually the longest wave. An impulse runs into the direction of the main trend. After wave 3 is complete, the wave 4 pullback typically finds support around the 38.2% retracement of wave 3. The market then breaks through the top of wave 3, to complete wave 5, which is the last wave of a 5-wave cycle. In an impulse, wave 4 must not overlap with wave 1. Also, wave 3 must not be the shortest wave out of waves 1, 3 and 5. Wave 2 must not break below the beginning of wave 1. There are many more guidelines that need to be considered when applying Elliott Wave.

Understanding these principles can significantly enhance the ability to anticipate market movements and make informed trading decisions. For more in-depth information about the different Elliott Wave structures, feel free to join our memberships, which include a lot of educational material.
